See how to create your own analyses with
HitHorizons UK Screener in 4 easy steps:
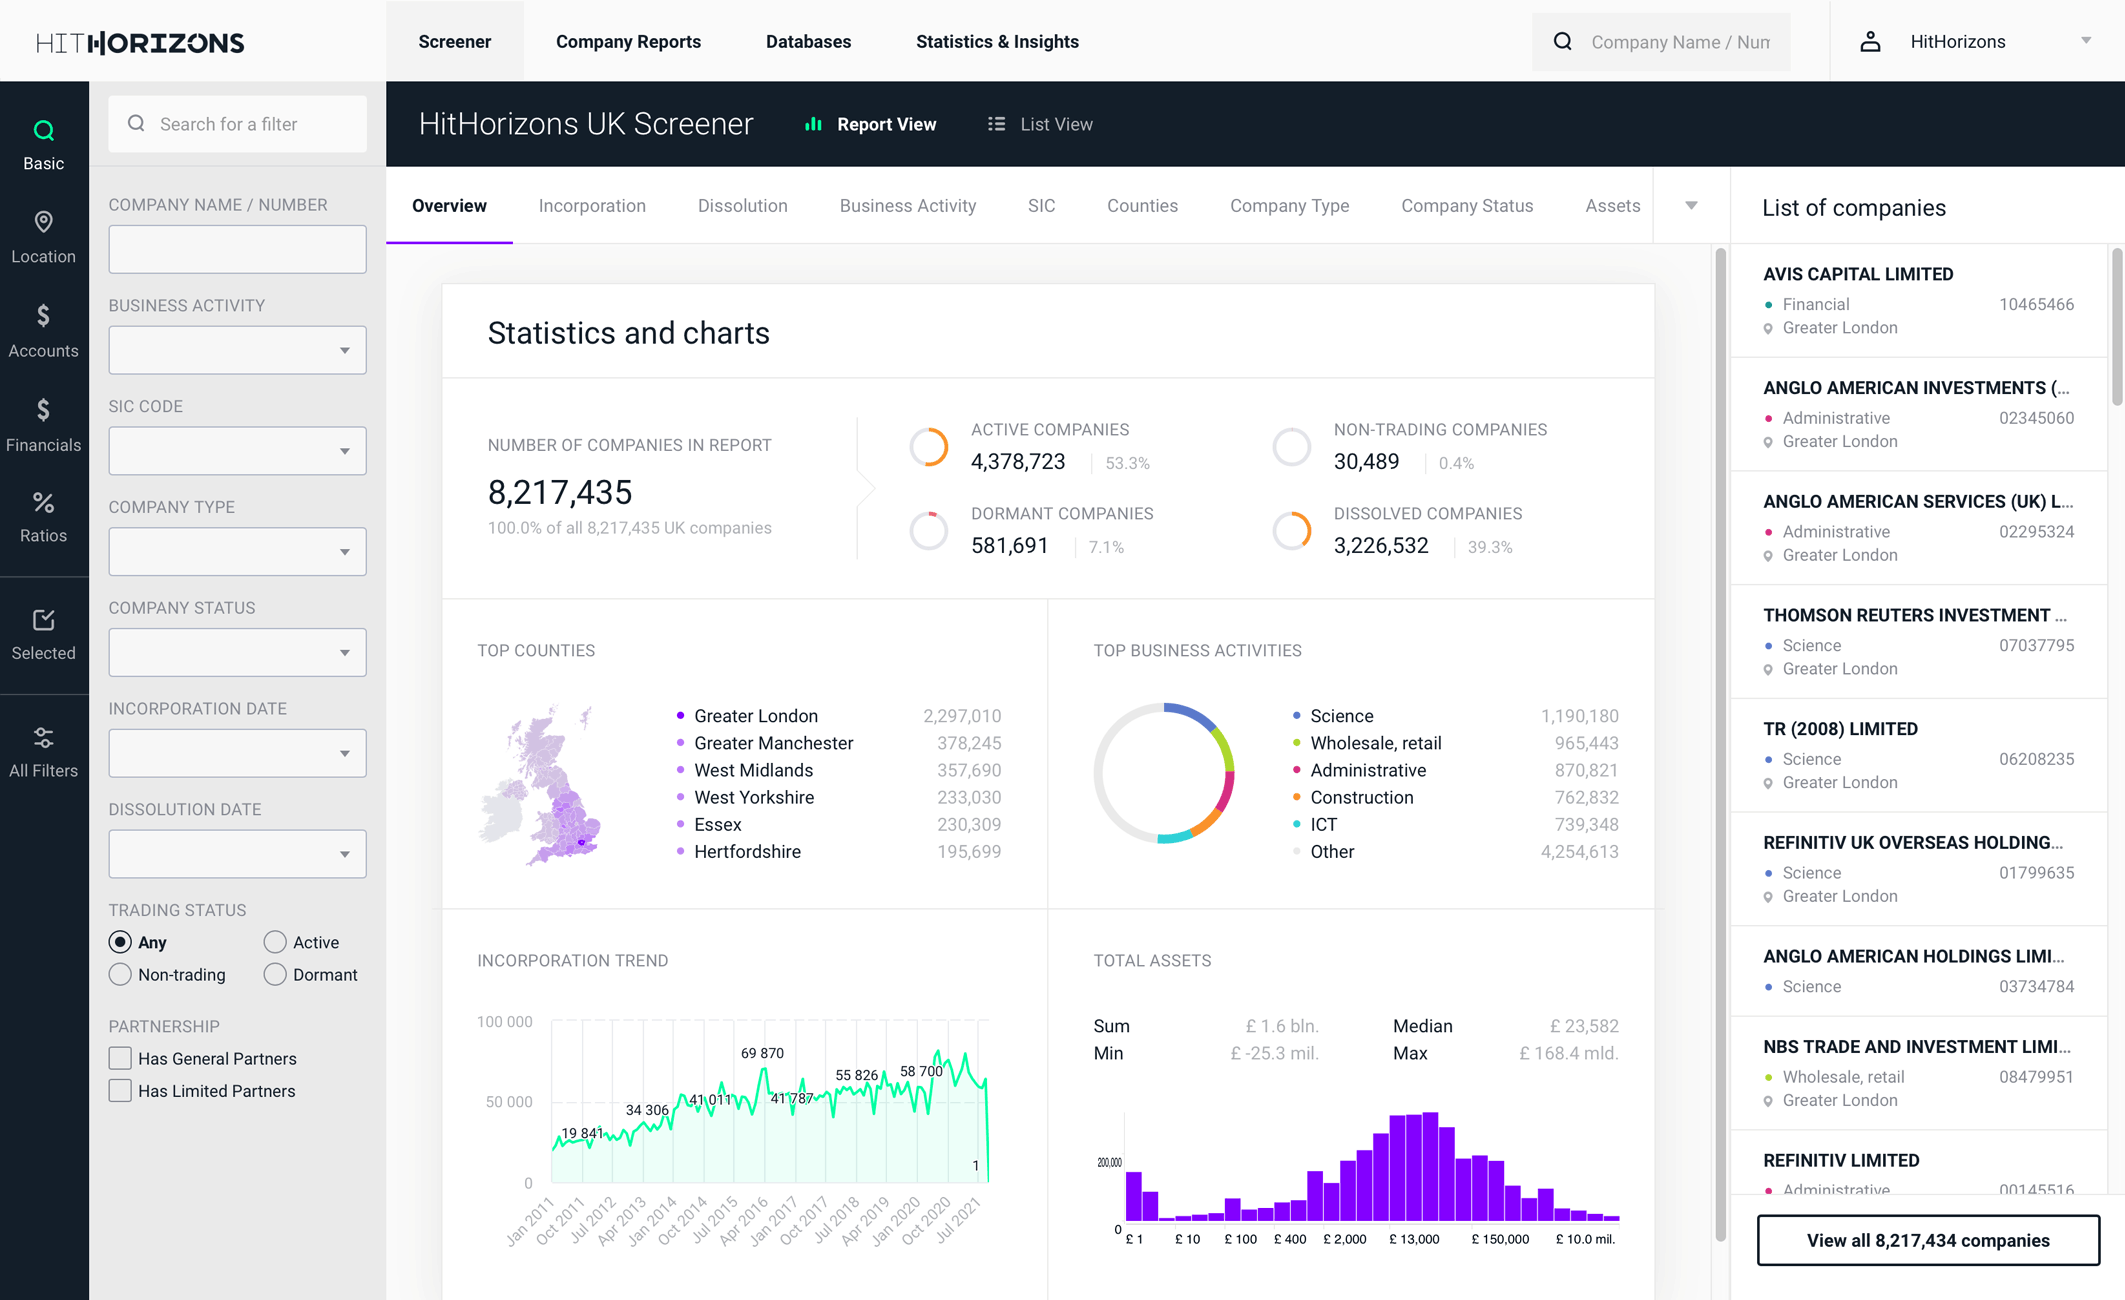
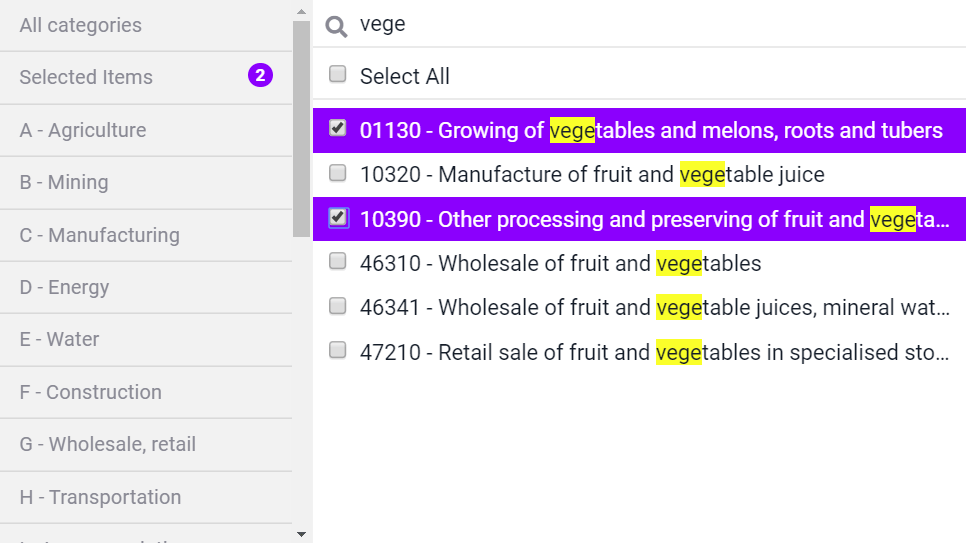
Step 1 Select specific company segment
Use 68 filters to compile a list of companies - choose among location, industries, financials and other criteria.
This wide range of criteria allows you to cover any use case – from analyzing of all 6 mil. companies at once or studying well-defined analytical samples – in easy to use interface.
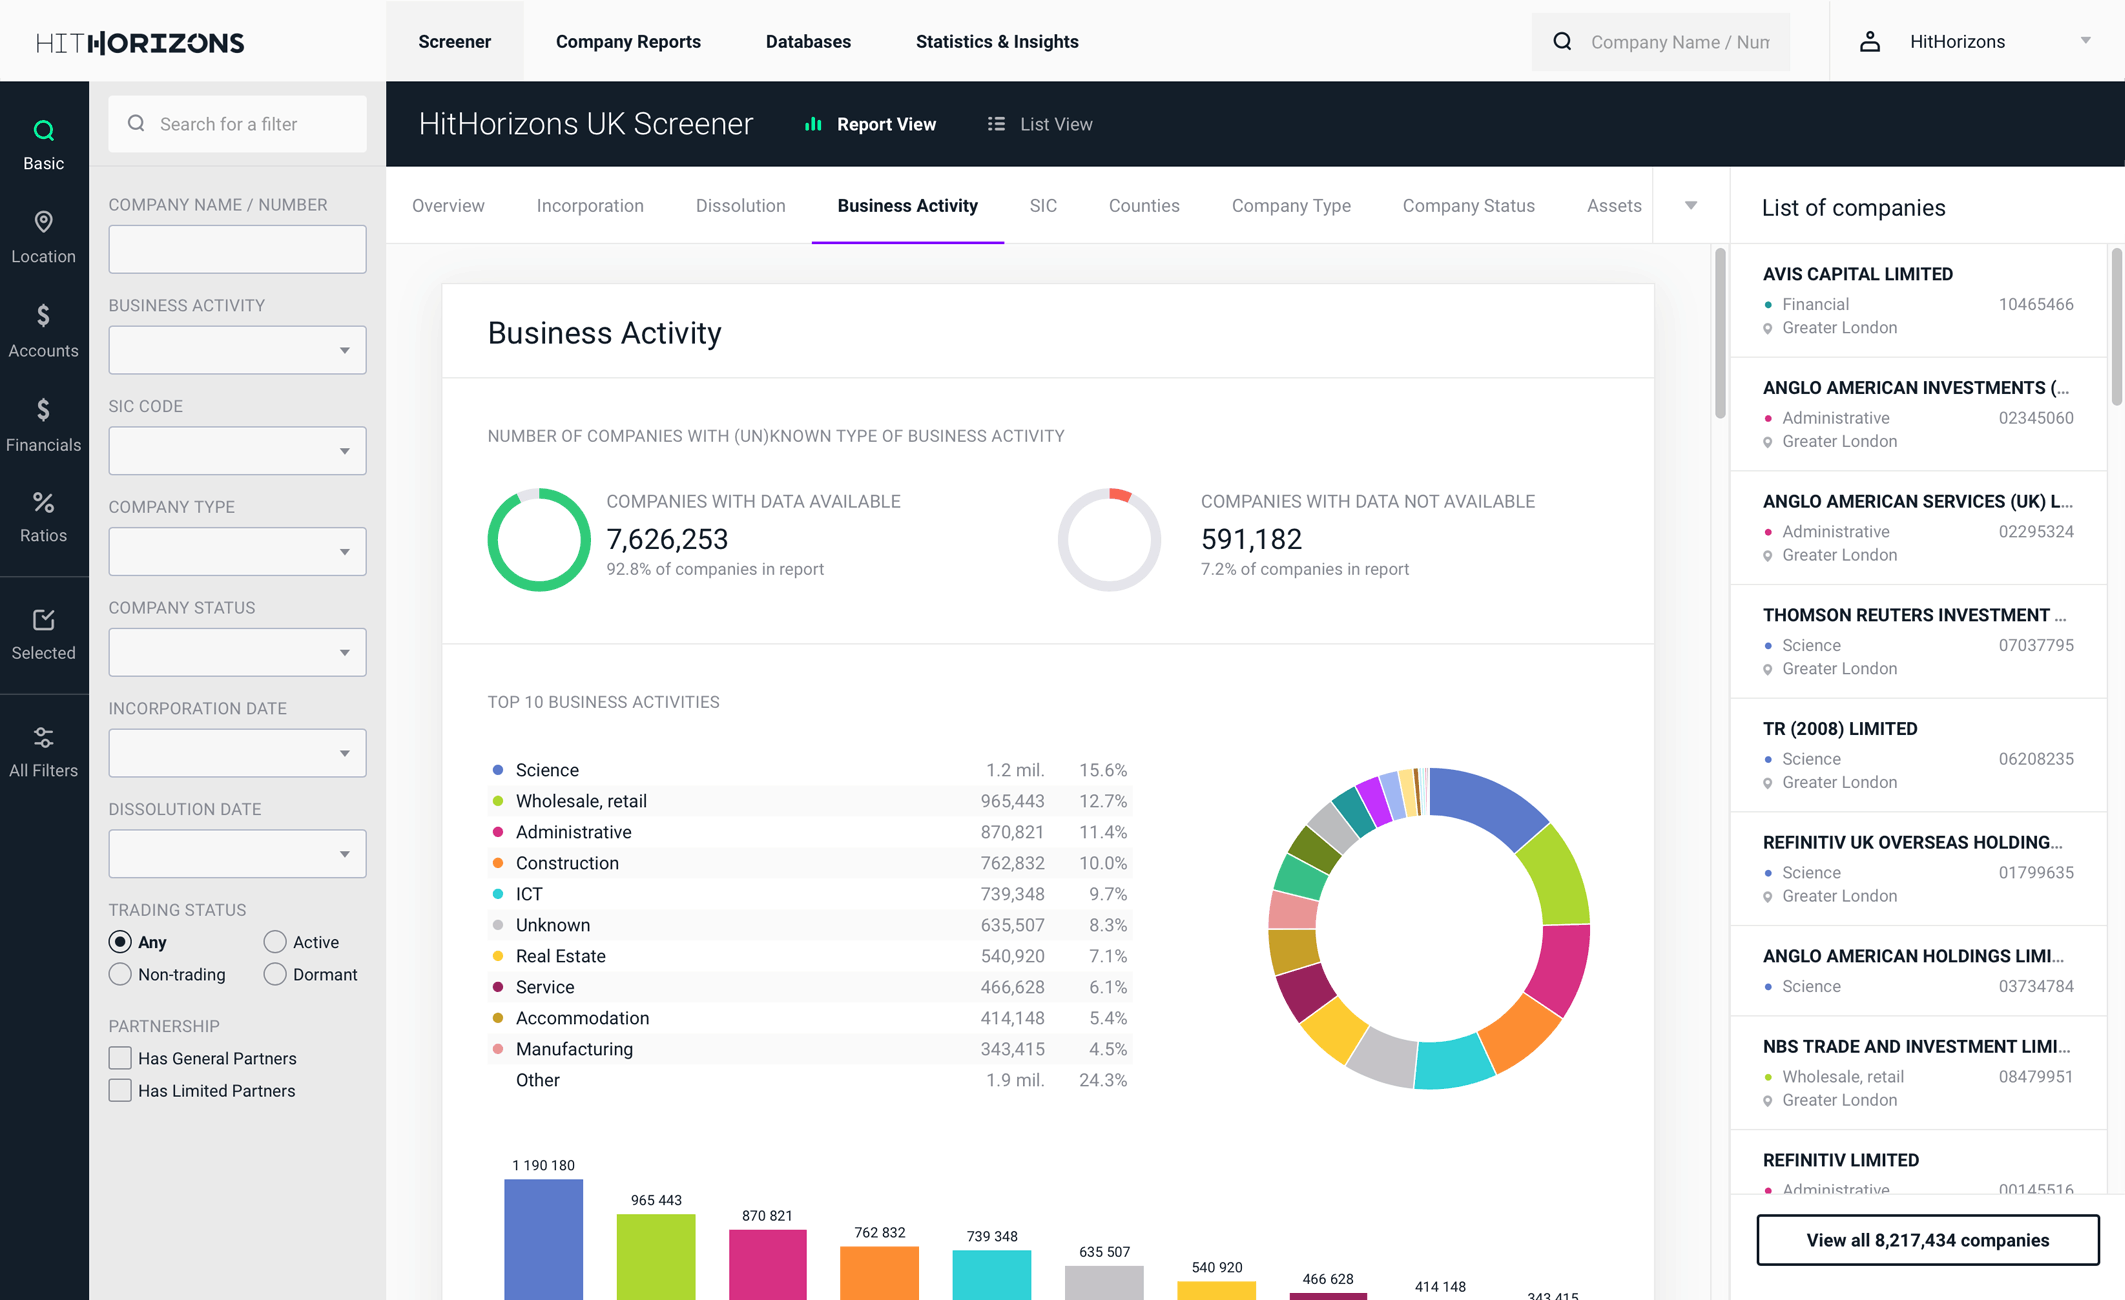
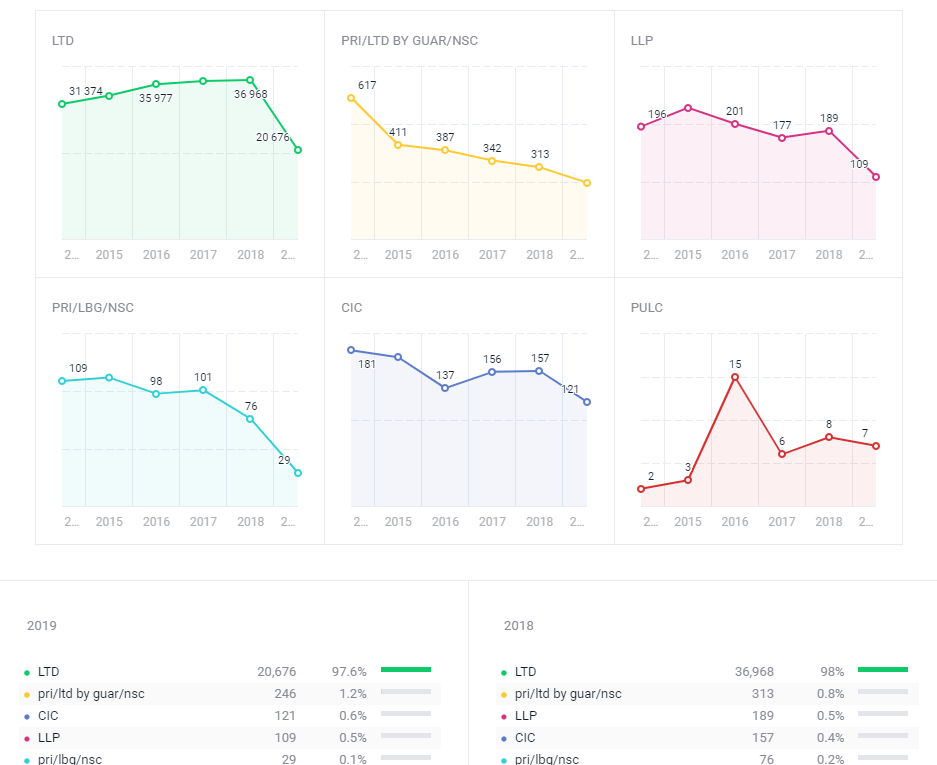
Step 2
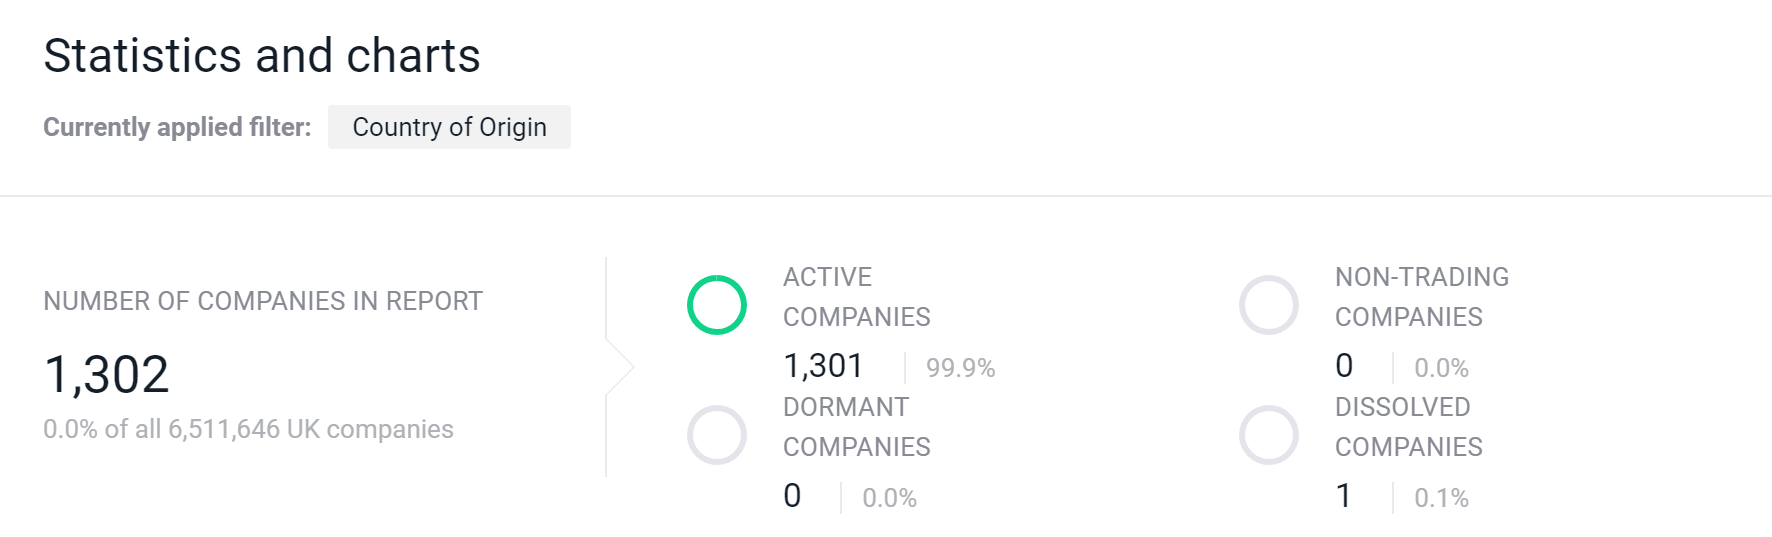
Instantly receive prepared
industry and regional analyses
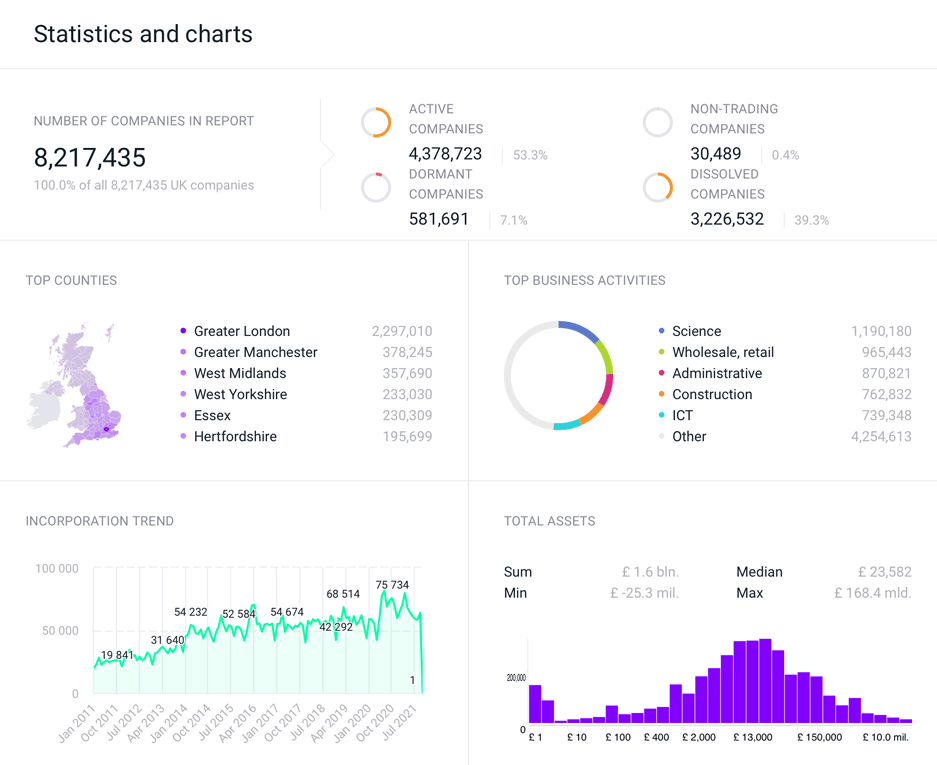
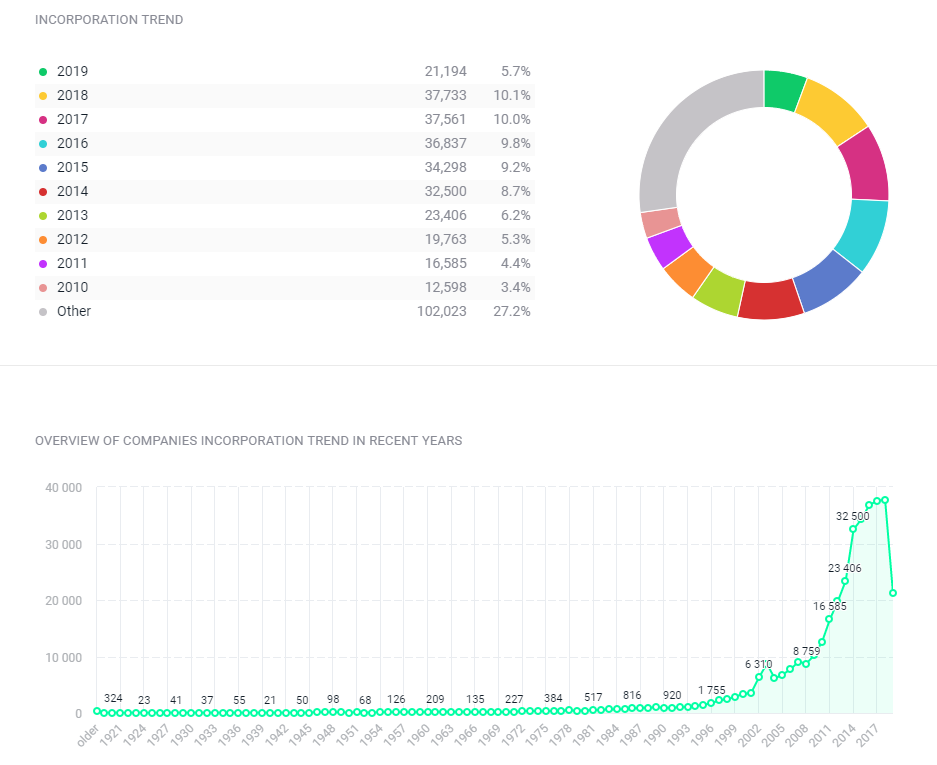
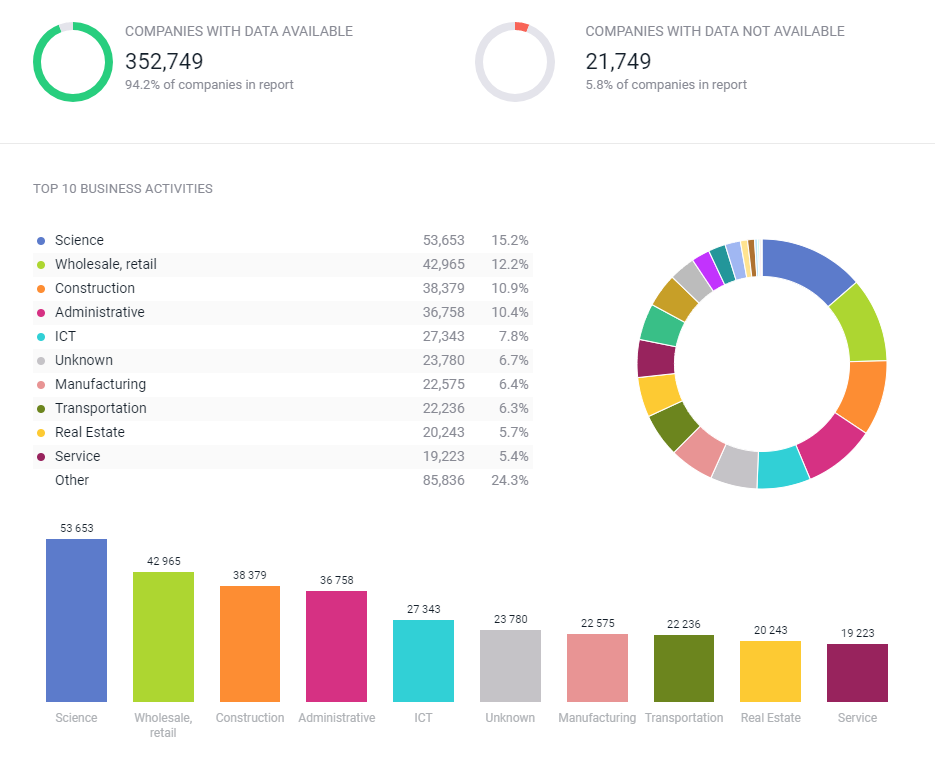
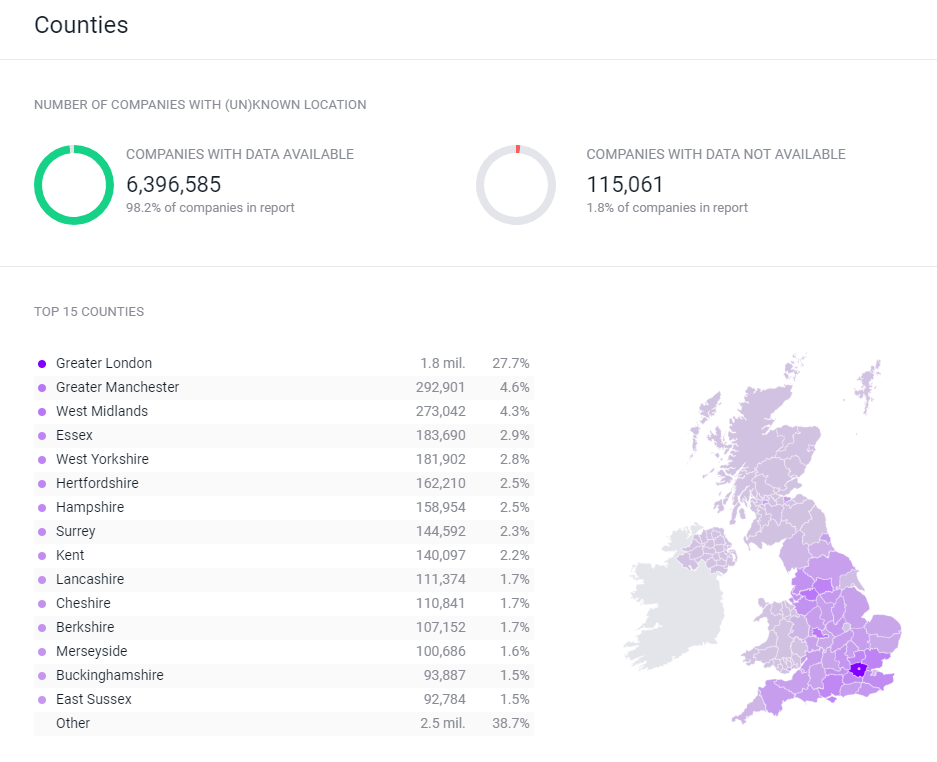
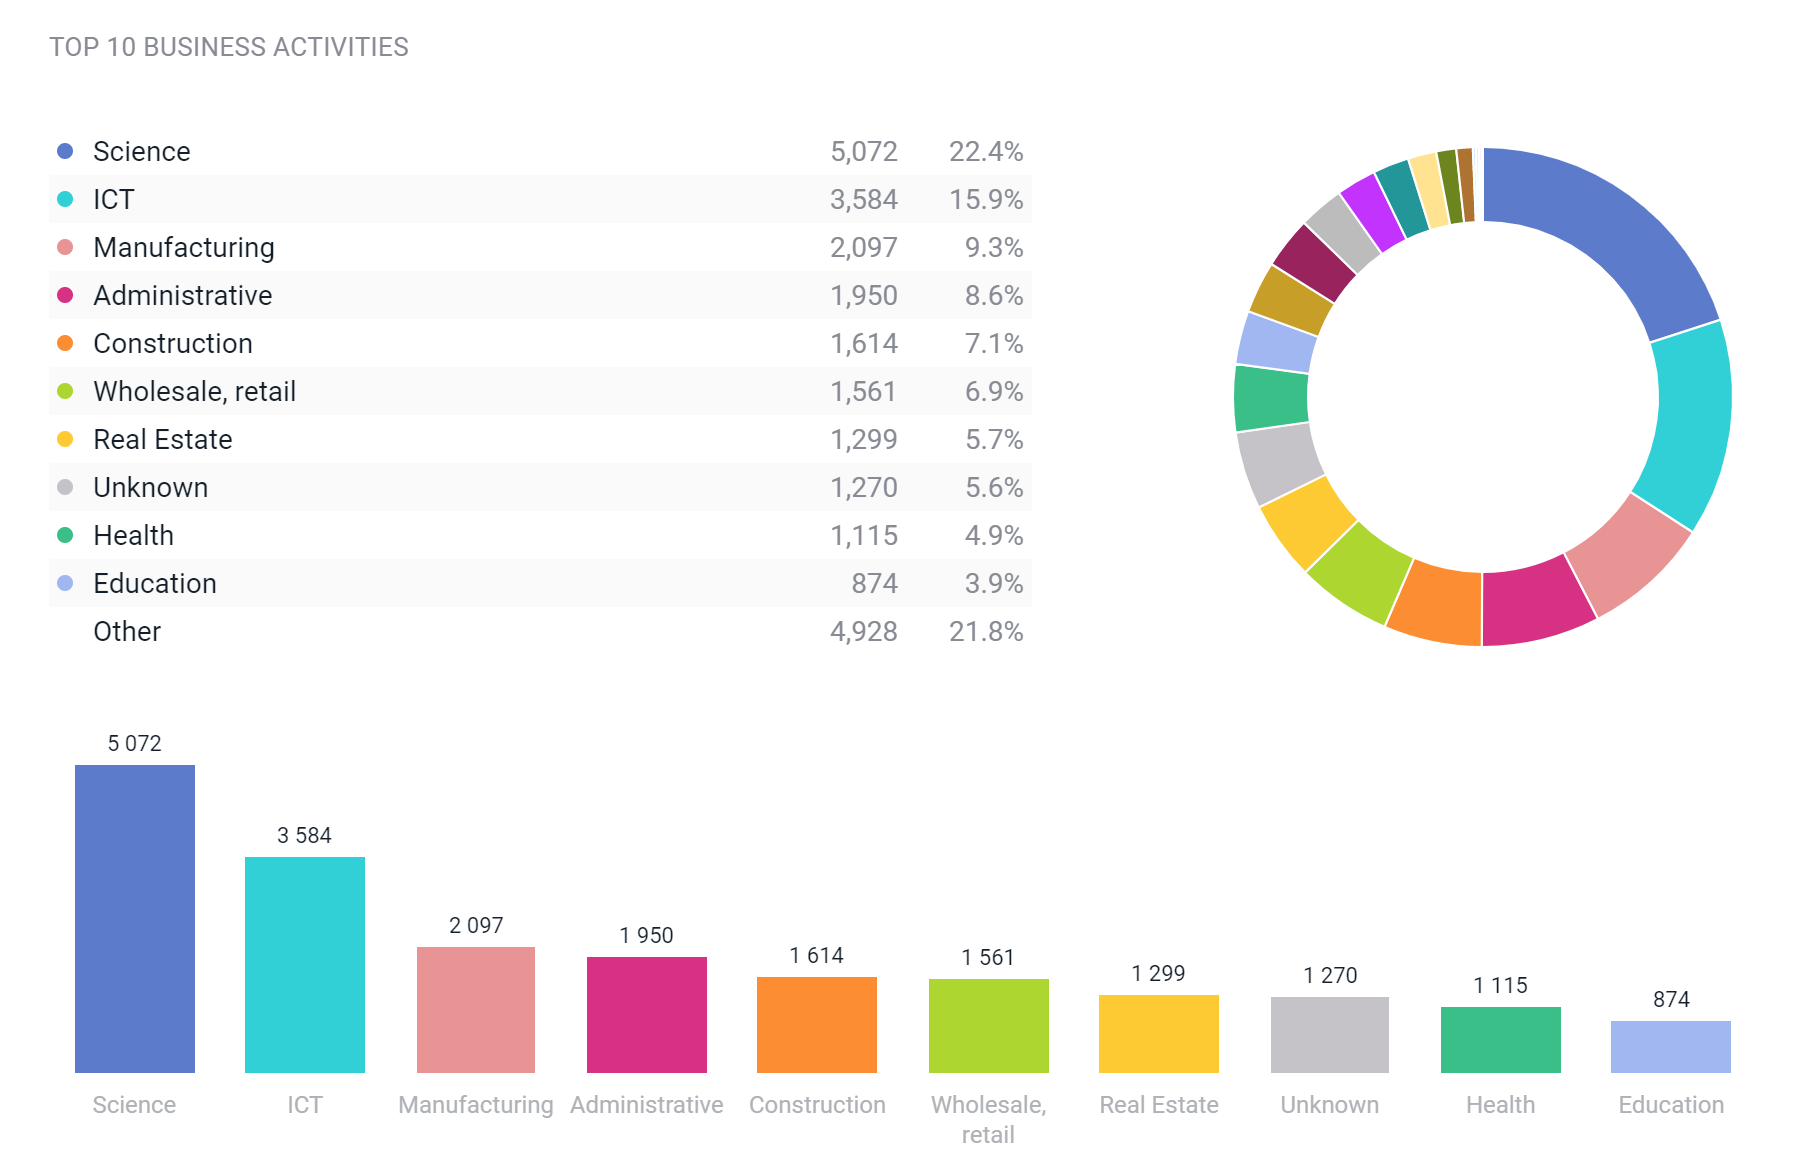
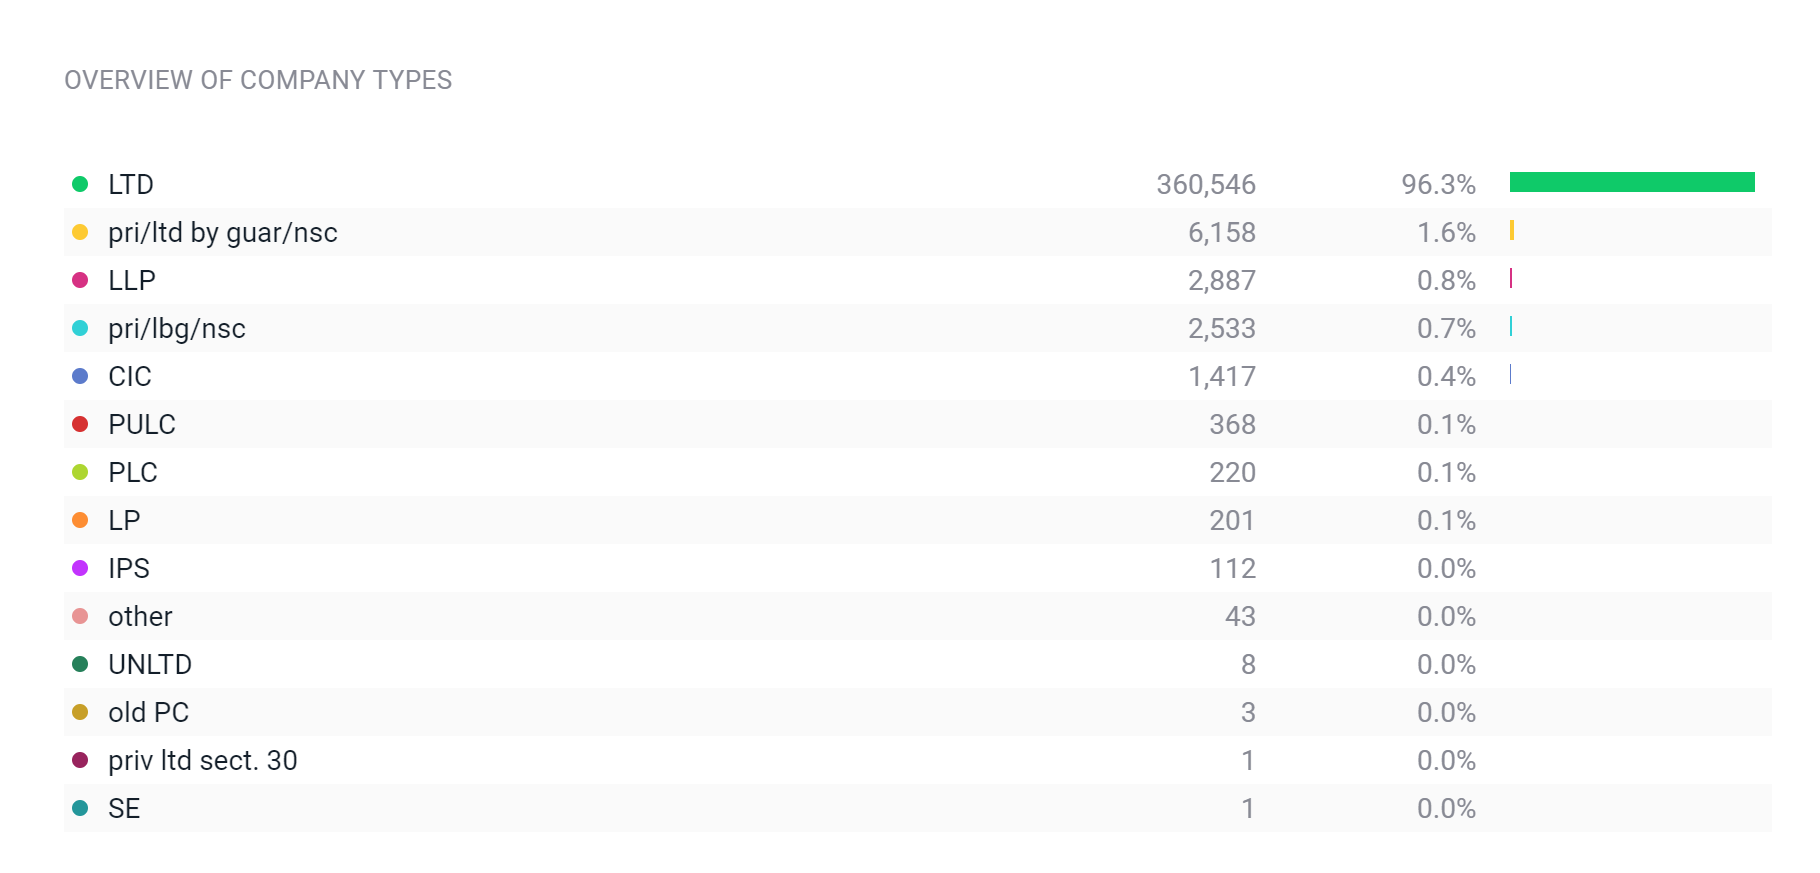
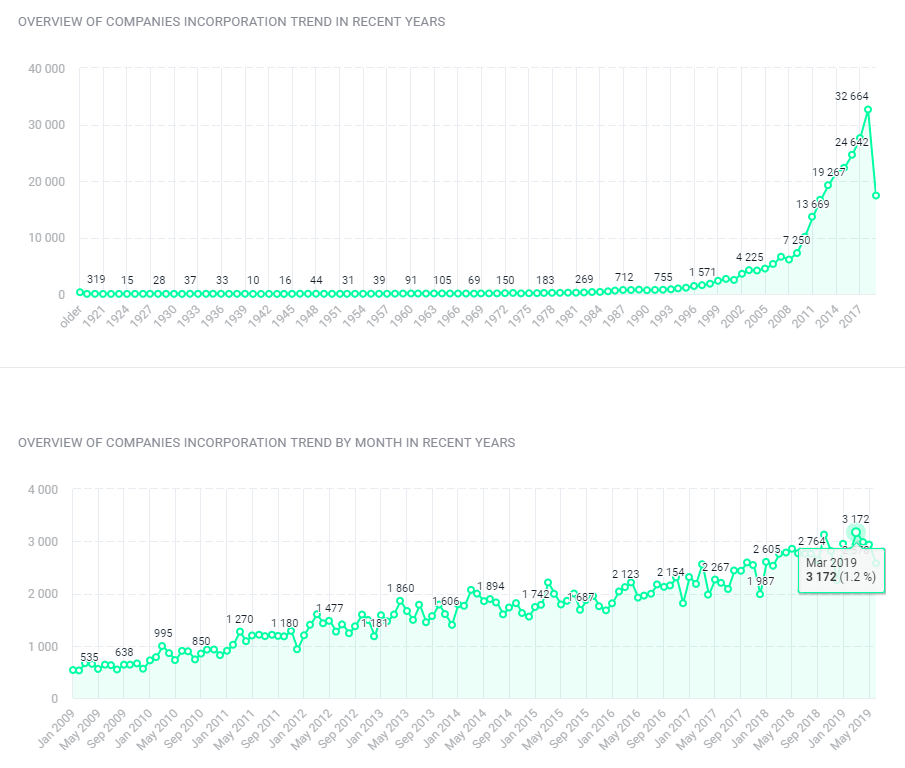
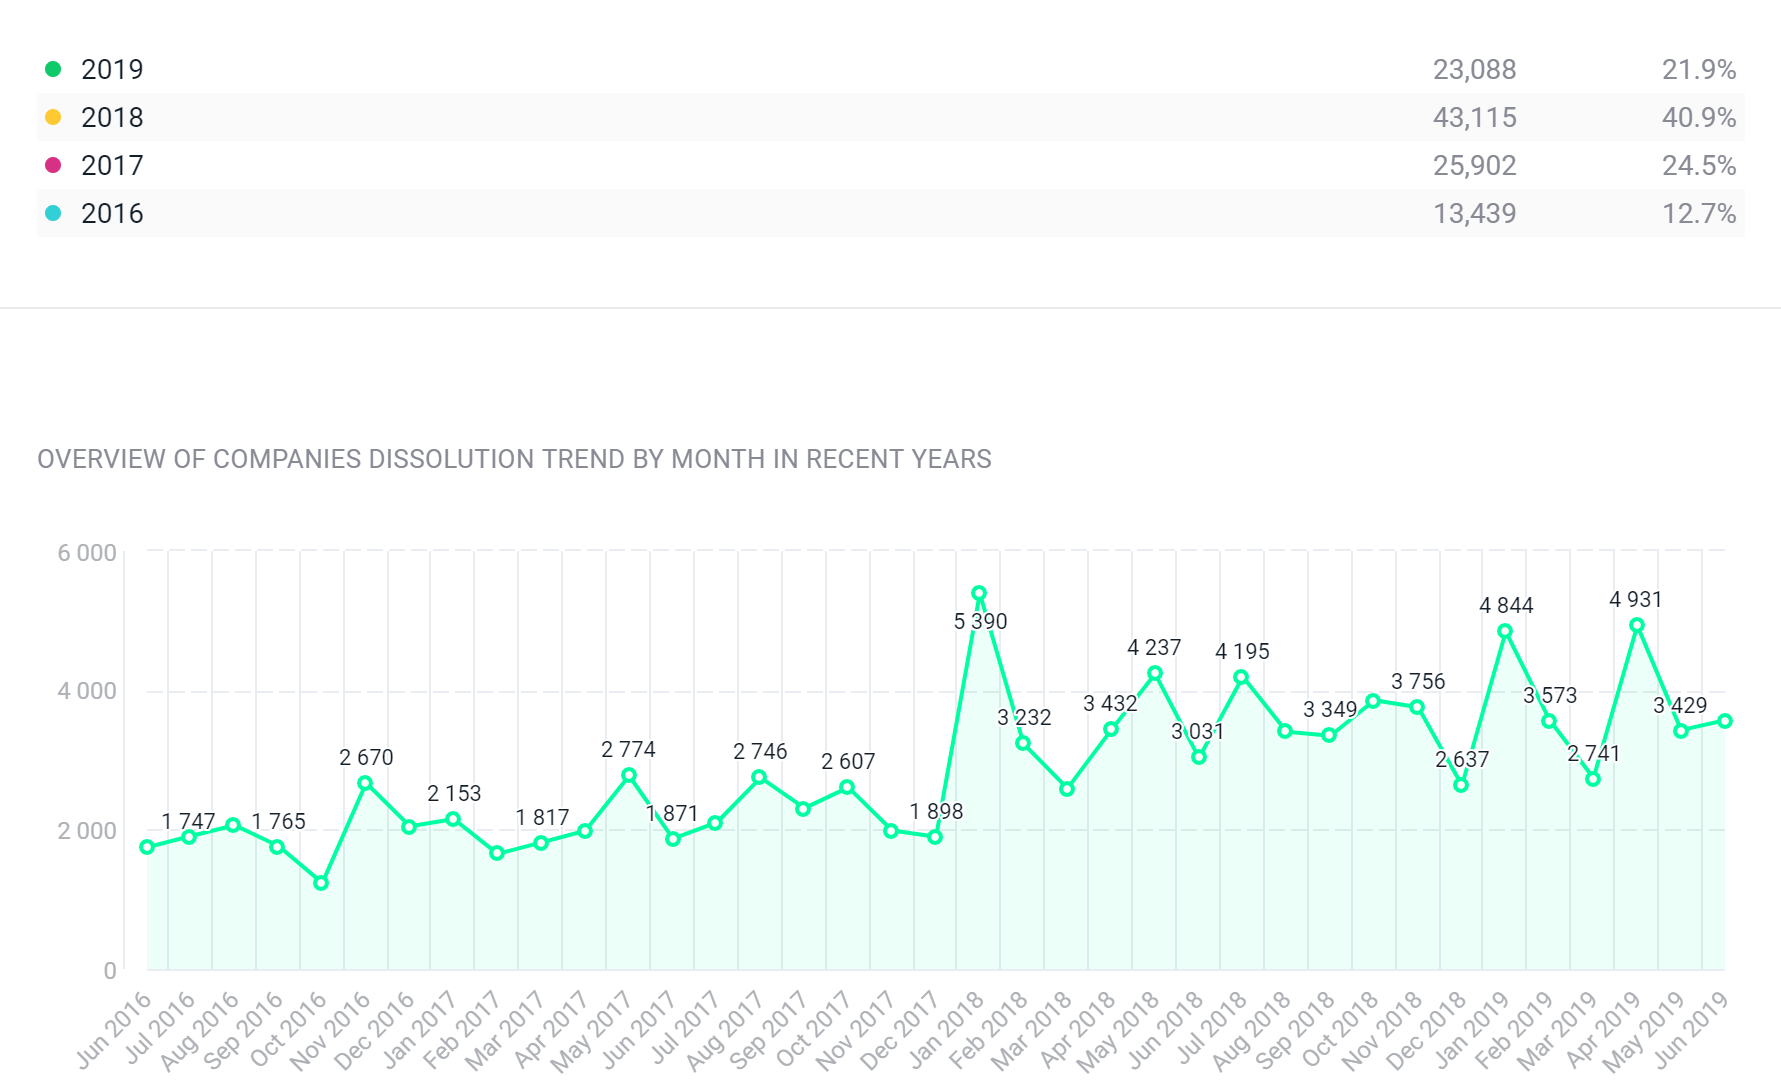
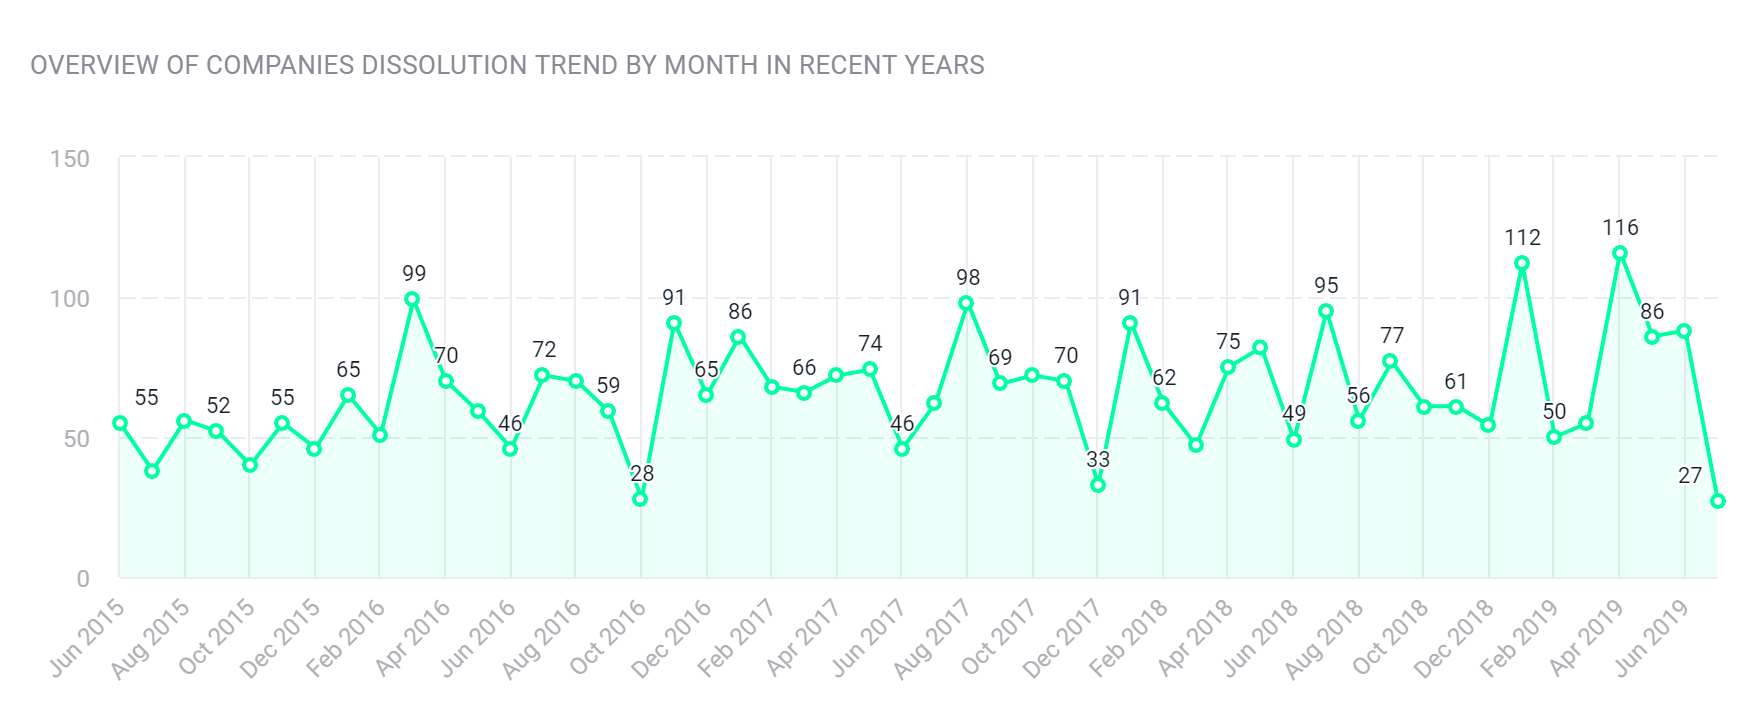
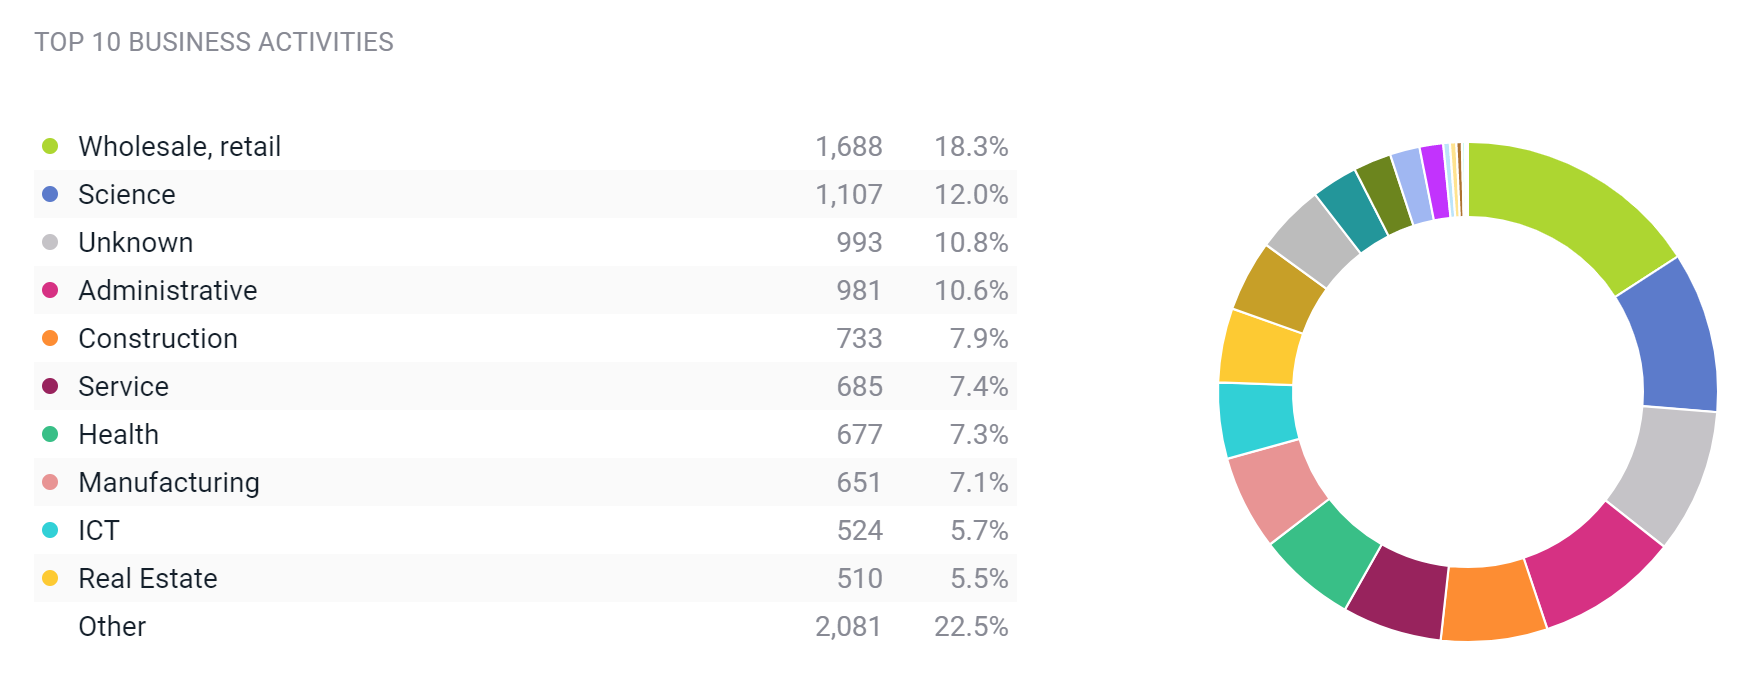
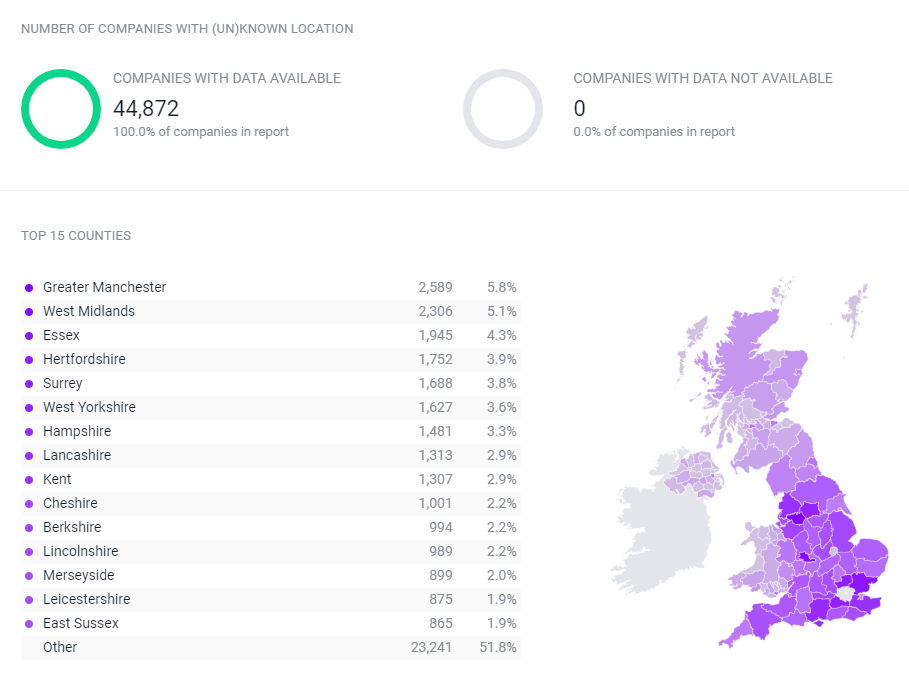
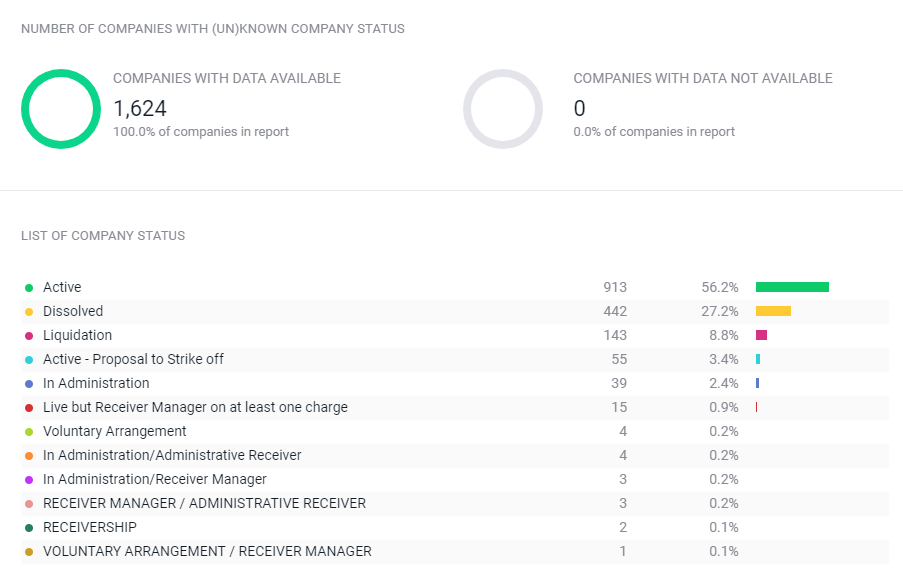
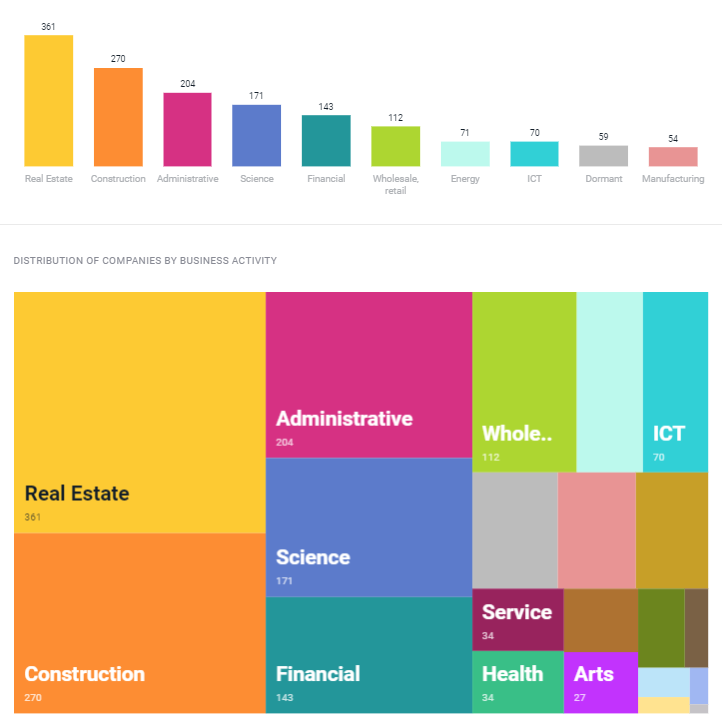
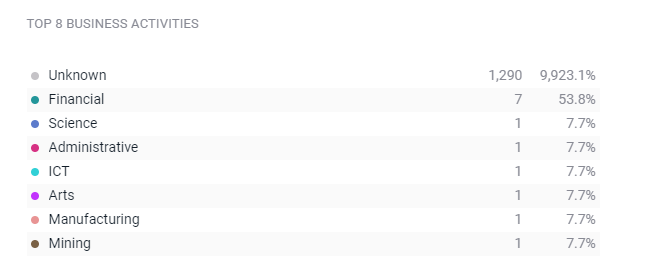
The analyses is made of over 300 ready-made methods, formulas, statistics and charts divided into 13 components: incorporation and dissolution trends, distribution of companies in UK by business, SIC codes, counties, company type, company status, various financials and ratios.
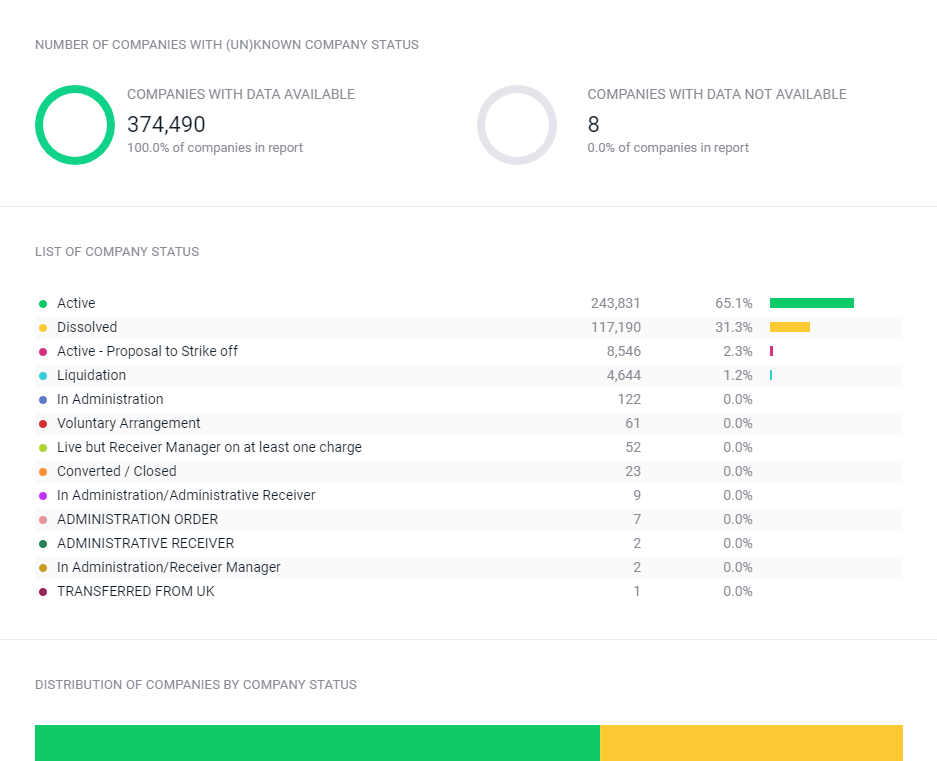
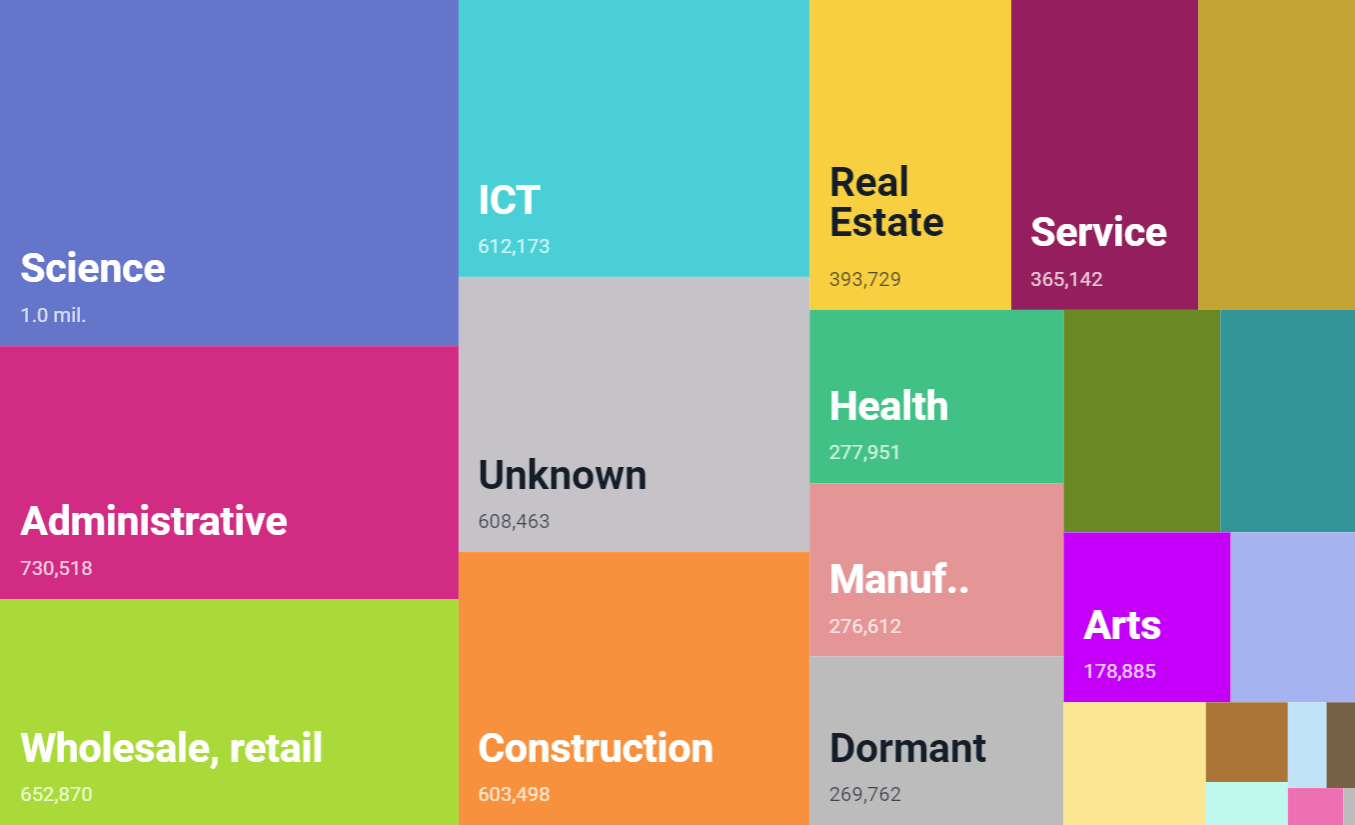
Step 3
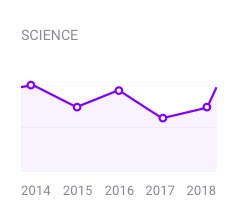
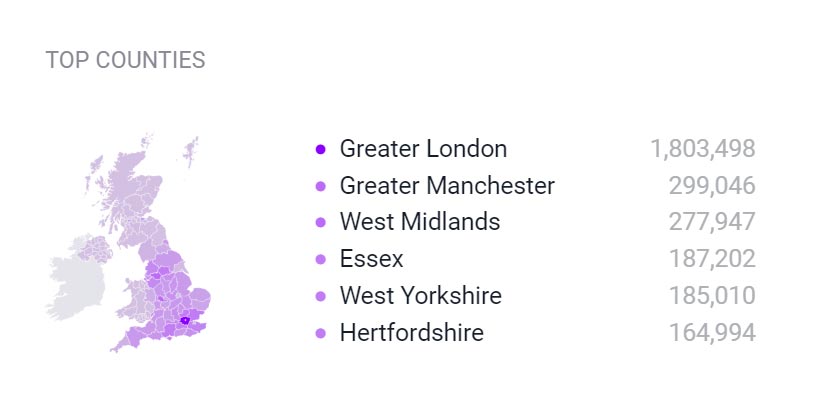
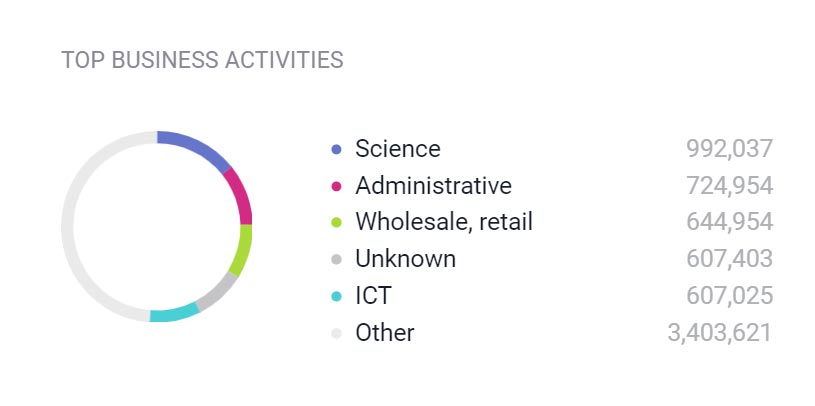
Gain insights through
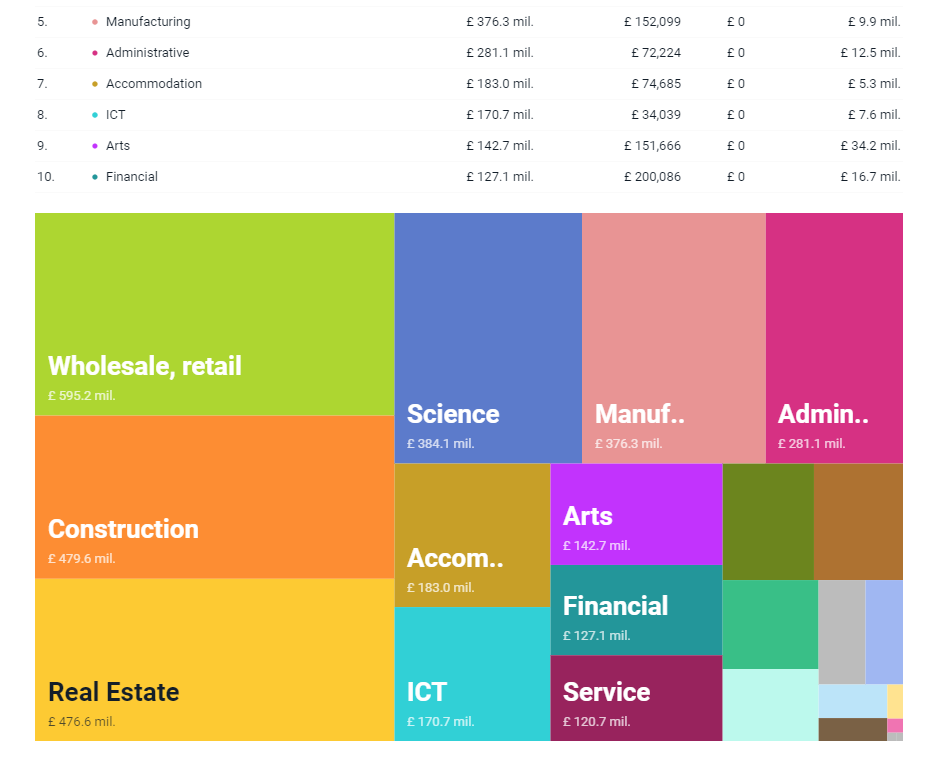
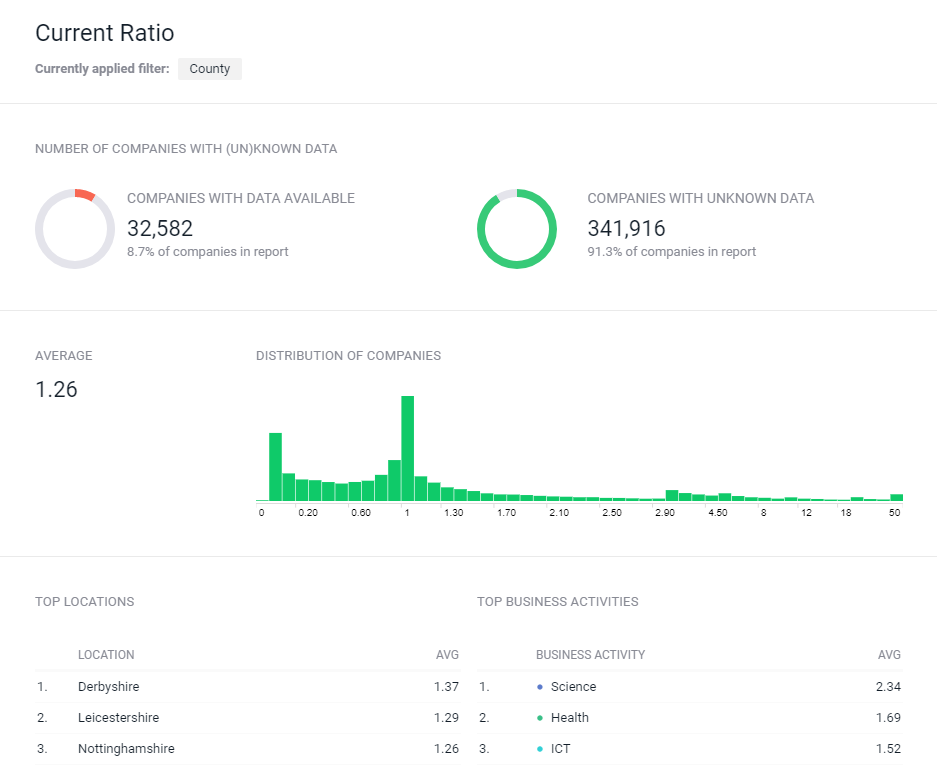
smart and beautiful visualisations
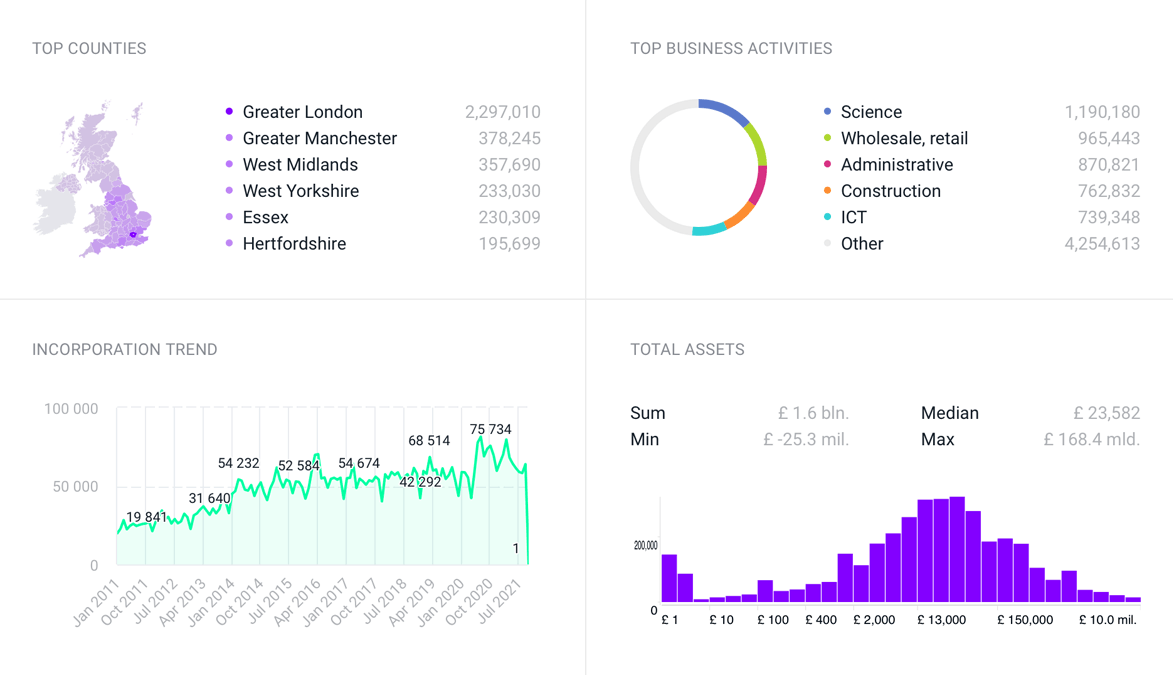
Our solution presents rich and meaningful visualizations, infographics, reports and presentations of any company segments in 13 components.
We have hand-picked the best visualisation type for each part of analyses so you can get real-time insights with hundreds of beautiful and smart charts, graphs, heatmaps, histograms and tables that are updated with each parameter adjustment.
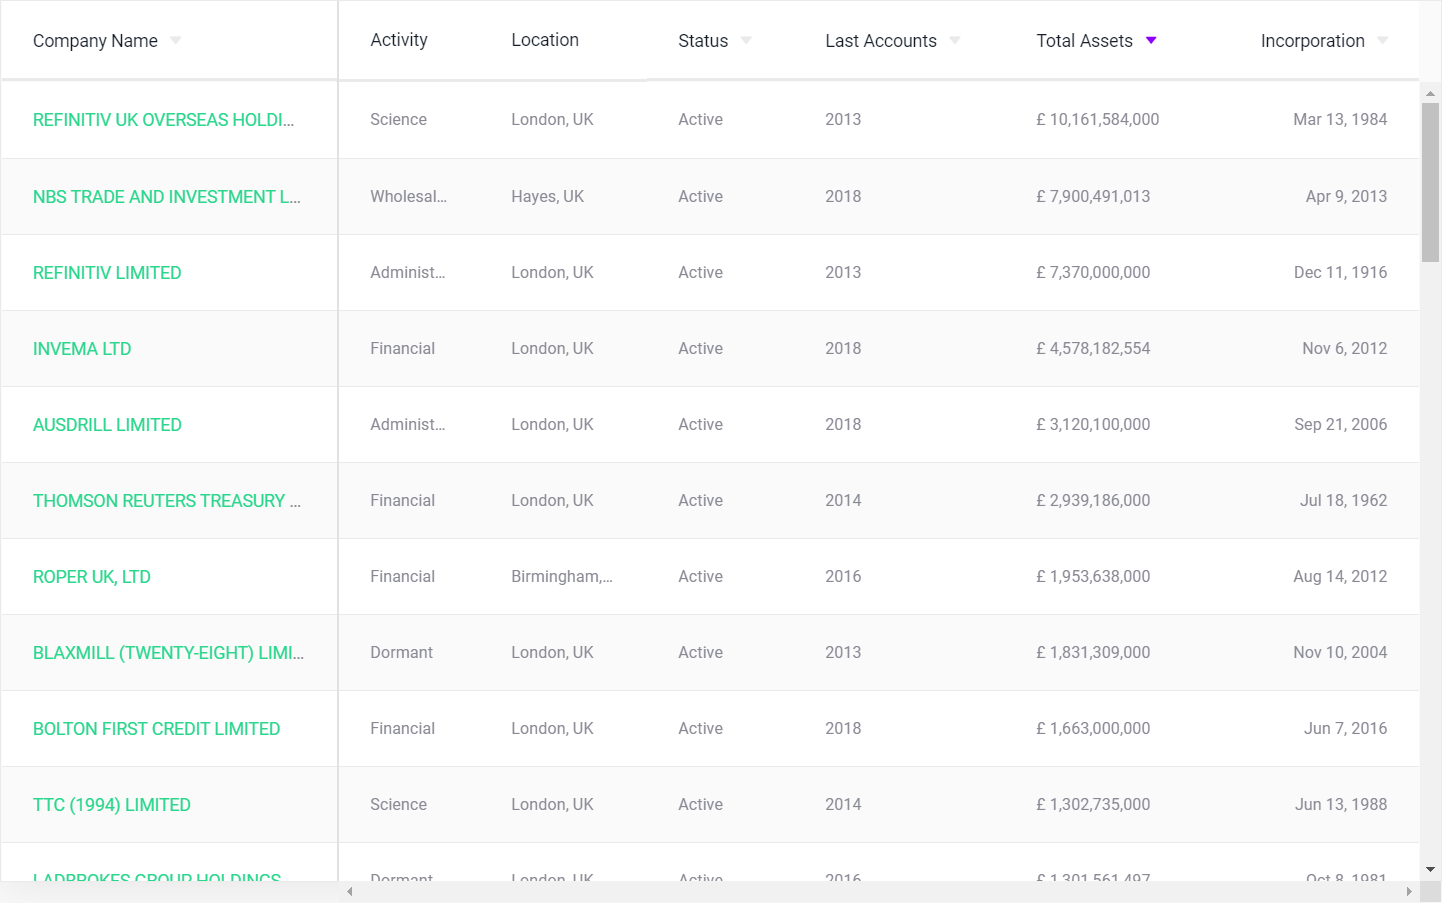
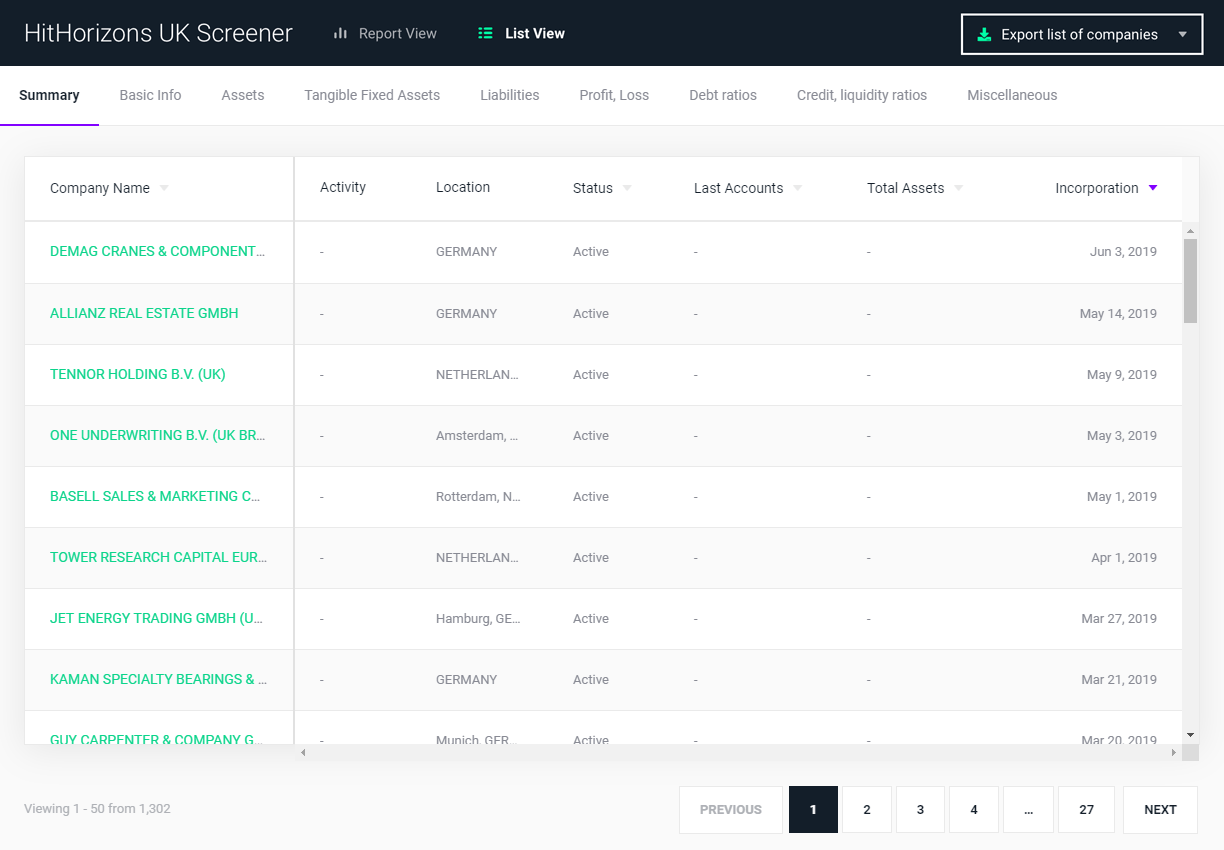
Step 4 Sort companies & download to XLS/CSV
A list view of companies allows you to sort by over 60 values: financials, ratios, name, incorporation and dissolution dates and more. Create various rankings online or work with selected company’s data in convenience of your own software by downloading data of companies to XLS/CSV.